Topography Neural Net
Attempting to estimate topography of a region from image data
Introduction
The ultimate aim of this project is to create a neural net that can accept satellite image data as input and provide a matrix repesenting the rough topology of the area imaged.
Motivation
The primary motivation for this project is as a learning exercise for myself in machine learning and convolutional neural nets. This project gives me an opportunity to establish a data pipeline, design a neural net, implement it, and train it and examine the results. I’ve definitely learned a lot from this opportunity to get my hands dirty, chiefly that the largest challenge is not in the network architecture, but the data gathering. Of all the time spent on the project, probably 90% was spent on data gathering.
Potential applications
I must admit to a sincere ignorance of current methods of gathering topography data, and their various advantages and disadvantages. The list below is my best guess at situations and applications in which this model might have some usefulness. I welcome and appreciate any additions or clarifications anyone would like to make.
- Emergency services - In the event of a major landslide, it would be very useful to know the new topography of a location. I presume that instruments which accurately topography might take some time to deploy, whereas there are several companies launching satellite fleets that will attempt to image all of the Earth once every 24h. So, if this net works even to some reasonable accuracy it could be useful in these emergency scenarios.
- Planetary landing - For probes that land on planetary bodies, it is crucial to know the topography in order to ensure landing on a relatively flat and debris-free surface. Images obtained during the descent process could be transformed into topography with this net and this information could be fed into the landing computer, ensuring a safe and level landing.
- Hard-to-reach areas - Perhaps there are areas whose topology is difficult to estimate accurately due to their, ahem, topology. A model such as this one could provide some first order estimates.
Training data sample
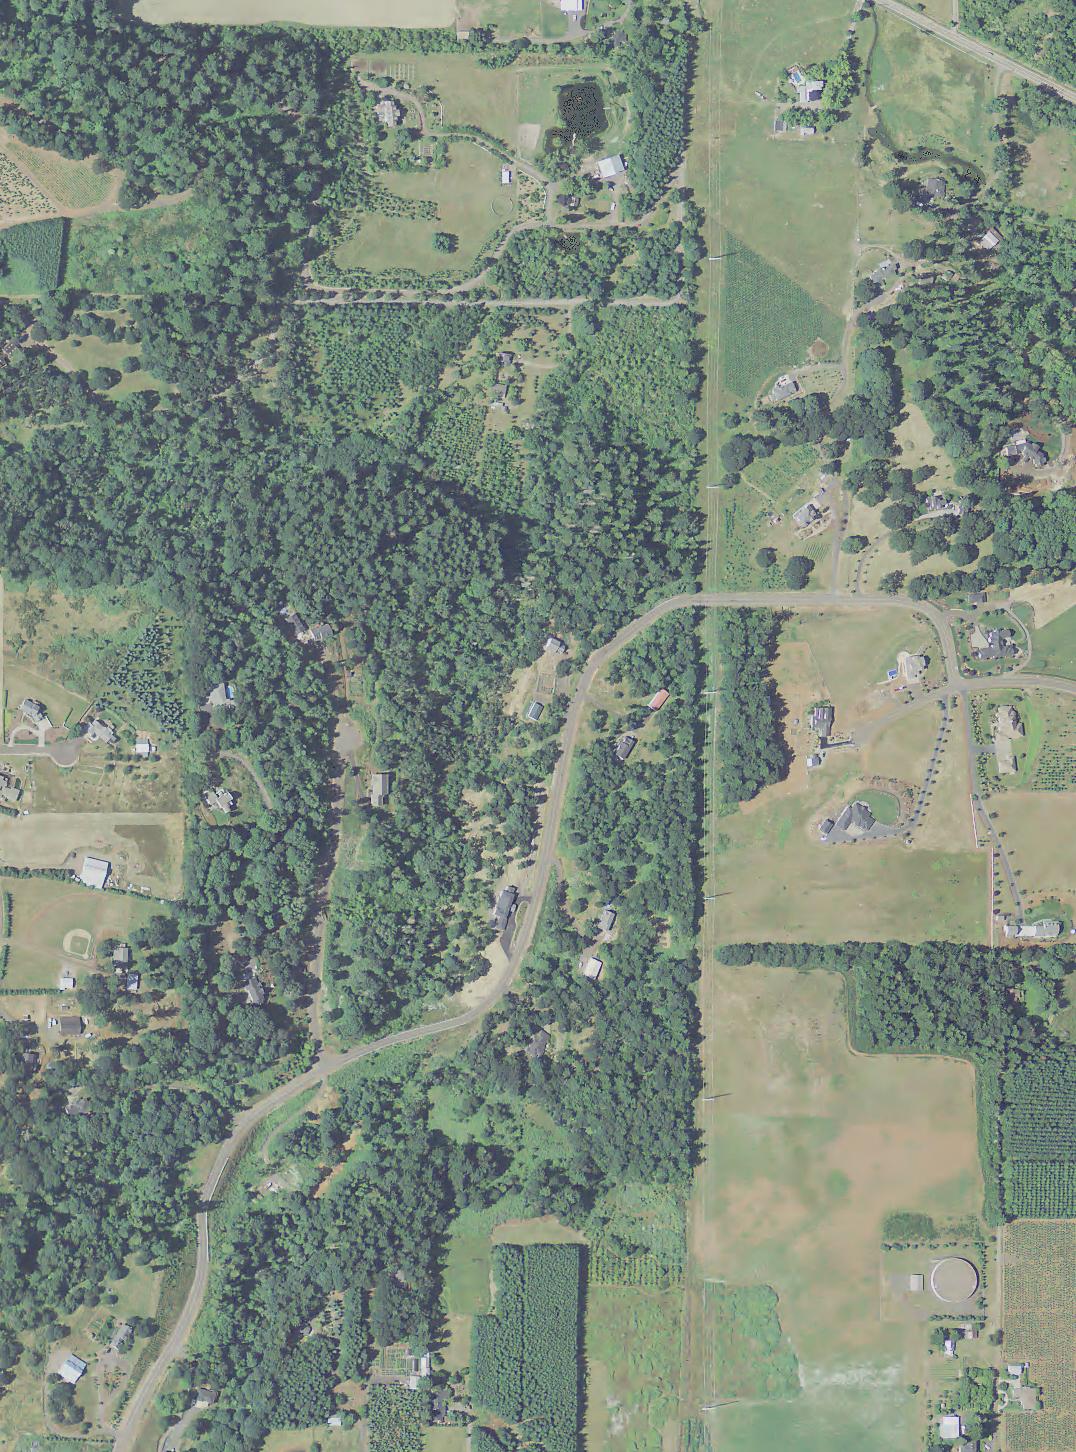
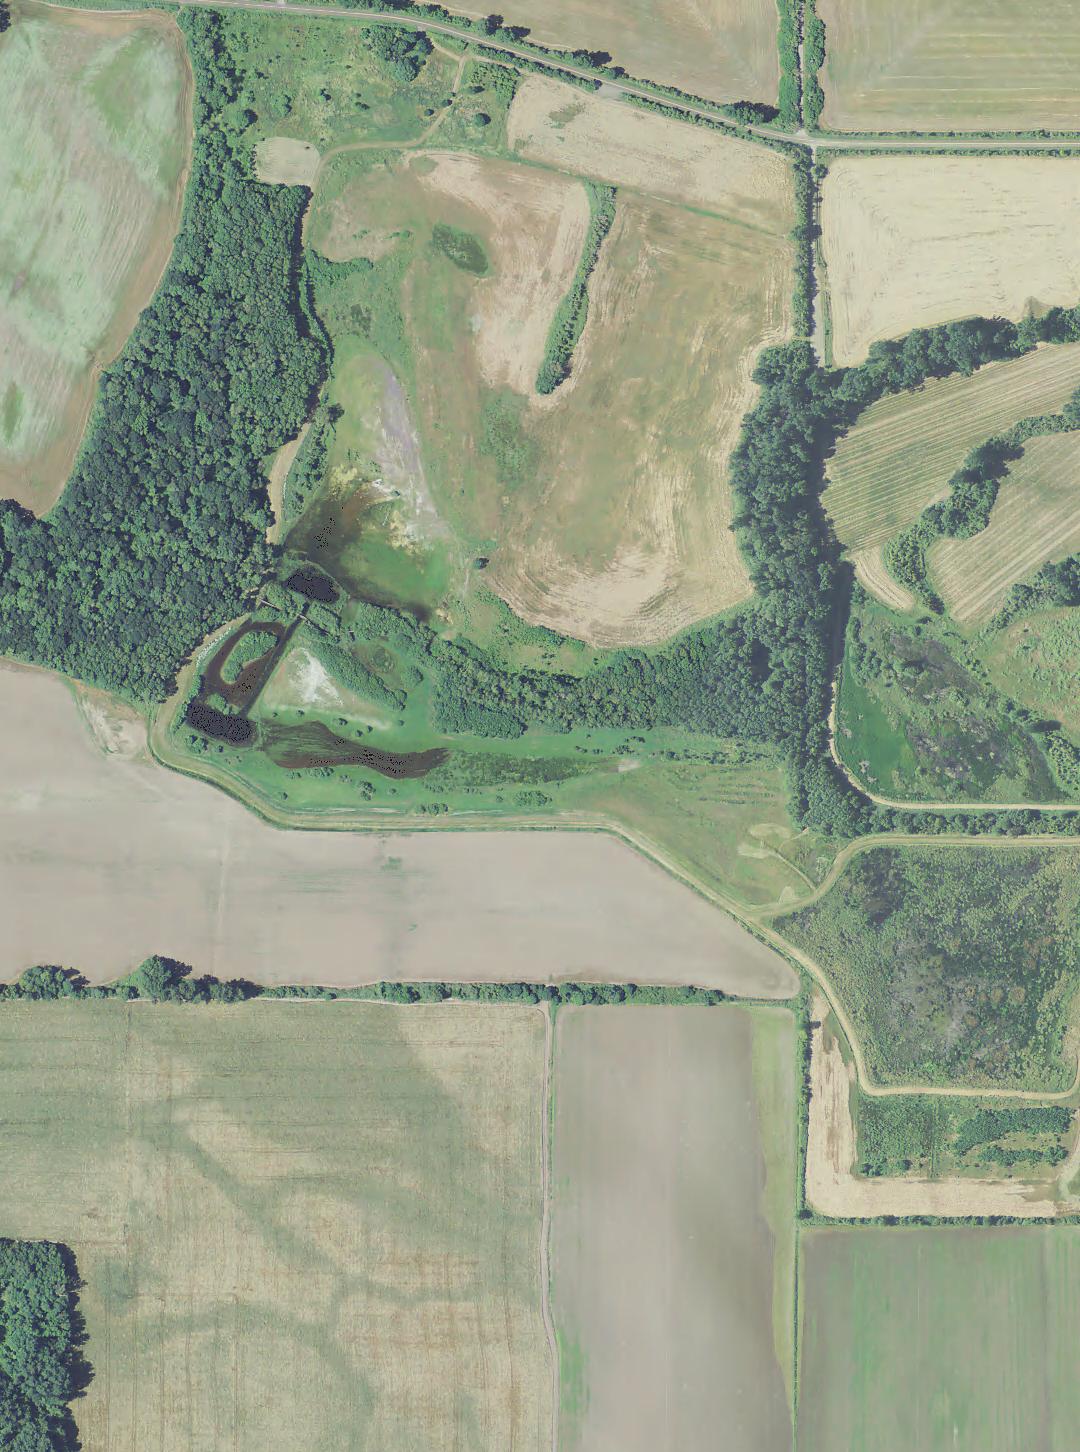
The training data consists of an image paired with pixel level topography data which originated from a LIDAR scan. Below is a one of the image/topography pairs in the dataset. In order to limit the network to learning general topography, as opposed to learning the shape of trees or such things, the topography data is mean-pooled with a 16x16 filter.
Evaluation data sample
Below is an example of the end goal. On the left is a satellite image. In the middle is the original topography data (subsampled), and on the right is the output of the neural net applied to the image on the left. The image on the left is not in the training set. You can see that the network picks up large regions of similar color and picks up on gradient changes, but there are large swaths where it fails entirely, like towards the right side of the image and also in the middle towards the left. In both cases it estimates the terrain to be substantially higher than it really is.
Data source
The data is coming entirely from the United States Geological Survey (USGS). The image data is from the National Agriculture Imagery Program (NAIP) and the topography data is LIDAR data that is hosted by the USGS, but comes from “contracts, partnerships with other Federal, state, tribal, or regional agencies, from direct purchases from private industry vendors, and through volunteer contributions from the science community.” A custom pipeline was created to match LIDAR data with images and create a dataset. The dataset is being stored on Amazon Glacier and is available upon request.
Network design
Network design was iterated on several times. Ultimately, it was decided to use a simple 4 layer convolution-pooling design. Other designs were tried, including fully-connected layers at some points (ultimately discarded because the number of connections was absurdly large compared to convolutions), and deconvolutional layers (ultimately discarded after it was decided to heavily subsample to the topography data in order to avoid training the net on little details which are not relevant to the “bigger picture”).
Training
The training data set consists of 10000 pairs of [image, LAS file] (the LAS file contains the LIDAR data). Training data is augmented by rotations (4 total) and also translations (4 total), so the effective training set size is 160000. Later, 5 more translations were added, bringing effective training set size to 360000. The evaluation data set consists of 1000 pairs. Training takes place on a machine rented from Paperspace with a nVidia Quadro P6000.
Final training statistics
The network was training for 10 epochs with each epoch consisting of 160000 images. Afterwards, 5 more translations were added and the network was trained for 5 more epochs, each epoch at this point consisting of 360000 images. Every 200 batches (batch size was 10, so 2000 images) a random batch of images from the evaluation set were taken and the loss and coefficient of determination were calculated. At the end of each epoch, the entire evaluation set was evaluated. Below is a (subsampled) graph of those evaluations. You can see that the accuracy is very poor, with the coefficient of determination always below 0. While it appears that after 10 epochs, the accuracy was improving, further training with more translations showed that this was not the case.